Services
The Guide will categorise systems in two services. The edss induces energy savings by human interaction. The ems achieves savings by optimising systems. Stakeholders can choose from a wide range of features most suitable for their building type / portfolio.
Targeting Humans
The Energy Decision Support and Awareness Service (edss) delivers energy information and advice to residents, professionals and staff so that they can make savings day by day. In order to avoid wastage and bring about the hoped-for changes in behaviour, hints and guidelines for effectively saving energy are sent to PC, TV or smart phone; alternatively and where preferred, a set of personalised recommendations is presented by letter or in a personal conversation with an energy coach.
Targeting Machines
The Energy Management Service (ems) exploits the capabilities of smart metering and installed equipment. Energy management includes actions upon pre-defined events or thresholds and - where possible - self-learning automation of systems to keep the building at an efficient level with changing conditions. Energy management covers any form of production (e.g. boilers, renewables), the distribution process as well as devices consuming energy.
Service Features
Each service can have a wide range of different :term:`features`s. A feature can be implement in varying combinations optimised for user groups etc. Features are grouped and described once and examples are provided referring to pilot sites and projects (where varying product names might describe the same feature).
Selected features is described below. How to identify suitable features for your site is explained in Technical set-up, whilst details for implementation can be found in the Technical Documentation
Features for edss
edss visualises consumption in ways which are sufficiently user-friendly to attract users to explore their own data. Tenants or staff have access to edss through a web-based platform which allows them to quickly and easily obtain consumption information at numerous time-intervals. Online interaction should not, however, be the only way to approach users. Experience from real-world implementations shows that effectiveness can be increased markedly by combining online with offline modes of interaction.
Monitoring

Via sensors installed in the dwelling measuring consumption of heating/cooling, electricity and/or water, data are collected, transferred to a data centre, processed for visualisation and then provided on the user portal. Various presentation modes present monthly and annual consumption patterns as graphics covering monetary estimates for the bill and technical units (e.g. kWh, m³).
Benchmarking

Data already recorded can be benchmarked along various dimensions. Users are invited to compare their current consumption patterns to the data from earlier points in time or to data from reference groups, e.g. average over all dwellings in the same building. Visualisation through bar charts and statistics such as percentage decreases/increases can be provided.
In the residential domain, peer comparisons appear especially suited. This consists of comparison of energy consumption levels between similar-sized households. This information may include neighbours within of similar size in the same climate zone. It enables participants to see if they use more or less electricity than their peers, without disclosing confidential data (averages rather than figures for individual neighbour dwellings are being used).
Examples are Westerlo, Angers, North Italy
Personalised recommendations and advice

Zones (e.g. a floor) and individual users (e.g. tenant with ID) can be provided with recommendations and advice tailored to their individual consumption profile. This content is generated automatically. The software can pick-up on recent wastage or in areas where there is room for improvement. An app can then provide the user with means and advice on how to affect the next bill. However, no recommendations should be given if there is nothing to improve to avoid users “automatically” ignoring the feature.
Alerts

edss can also send alerts informing professional and/or novice users about unexpected data. Professional users are informed about leakages and interruptions in the data recording to avoid damage to the building and further loss. Smarter alerts can also detect behavioural issues of users. For example, a high heating consumption over a longer period which is not combined with an increase of the inside temperature can show an abusive opening of the windows. Tenants/staff in dwelling/zone are then advised about ventilation policies.
Self Assessment

A self-assessment enables users to develop realistic targets for their personel energy savings. This makes them active participants of the system rather than just passive actors receiving feedback. The simplest form is a target for their monthly bill to be displayed as a line in the chart on the portal. If the resulting daily “allowance” is massively overreached, alerts can be send. In combination with questionnaire, the portal provides the tenant with options for saving potentials including advice on whether replacing certain equipment might be cost-efficient.
Reports

Users cannot be expected to visit the portal (some might not have a computer) on regular basis and automatic messages might not be possible for technical reasons etc. In such cases automatically generated reports can help. A standardised format can be downloaded from the portal for print and/or send via email. In non-residential buildings it can be put on the public board. In residential buildings personalised reports can be delivered as mail or personally by the Energy Coach if saving potentials could be discussed.
Examples are Moulins, Extremadura, Solingen
Meetings / Courses

As part of the initial “recruitment” of users, at least one meeting should be organised to explain the service. Such a concept, can also be used to identify champions who can help their neighbours i.e. becoming promoters of the system and also transmitters of practical knowledge to those users who are hard to reach directly by, for instance, the housing provider.
Energy Coach

The ‘Energy coach’ is to help users understand energy efficiency and how it relates to the information provided by edss and the resulting energy costs. Activities of the coach include personal discussions; help with using the installed equipment and with the online portal; etc. prompted by a request from the user. With the necessary permission, couches can act proactively if they see high consumption on Reports or notified by Alerts. If funds are not sufficient for an Energy Coach regular Meetings / Courses (e.g. monthly) can be organised to give individuals opportunity to ask questions.
Examples are Moulins, North Italy, Karlsruhe
Features for ems
ems
Manage Consumption

Smart metering can also enable building operators and/or utilities to increase energy efficiency by centrally monitoring and managing their customer’s energy consumption. This can bring significant benefits in system efficiency and help achieve sizeable energy savings. Based on measured and monitored energy consumption, supply quality (i.e. outages, surges and sags, for instance) and event alarms, the power management system can suggest or initiate schemes for reducing energy consumption.
One application area are district heating systems delivering heated water to buildings, which are known to be more difficult to meter and control than individual dwelling heating. Once smart technologies are in place, these systems can automatically carry out partial switch off – boilers, pumps etc. – depending on demand parameters set by tenants. Tenants can arrange that temperature in individual rooms or throughout the dwelling are reduced during the night and during absence from the dwelling.
Peak Shaving

Peak shaving (often referred to as demand response) refers to the fact that major waste of energy and unnecessary CO2 emission continues today through networks meeting very uneven loads, often having fossil fuel power stations take on peaks then running idle (but not without emissions) in the interim. Peaks arise through the very uneven load curve over a typical 24 hour period, with very significant peaks arising from residential behaviour (e.g. cooking periods in the early evening) and non-residential buildings (e.g. use of AC around noon). Any method to shift time of use of energy (e.g. electricity) from peak use periods to times of lower demand makes energy provision more efficient.
Energy management in the residential environment can make a contribution to evening the load over time and in particular “shaving” peak consumption. This approach is based on the latency periods, heat storage capabilities or indifferent delivery timing of a number of domestic appliances from fridges to hot water heaters. The performance of heating and cooling devices with good insulation and therefore appreciable temperature maintenance characteristics degrades little over short periods of time. Quality of service to customers (household satisfaction with water temperature, fridge temperature etc.) is unlikely to suffer when these devices are cut off from the electricity supply for periods of many minutes.
As the strongest peaks are unpredictable and typically short term; response must be automatic and according to preset rules defined by the professional or utility. Such automation means that, through remote controllers in appliances, for instance an AC or electric heating thermostat is set to turn down or off during peak periods. ems enabling such dynamic, intelligent peak shaving can thus contribute significantly to energy efficiency in the residential and non-residential sectors.
Early Default and Maintenance Management

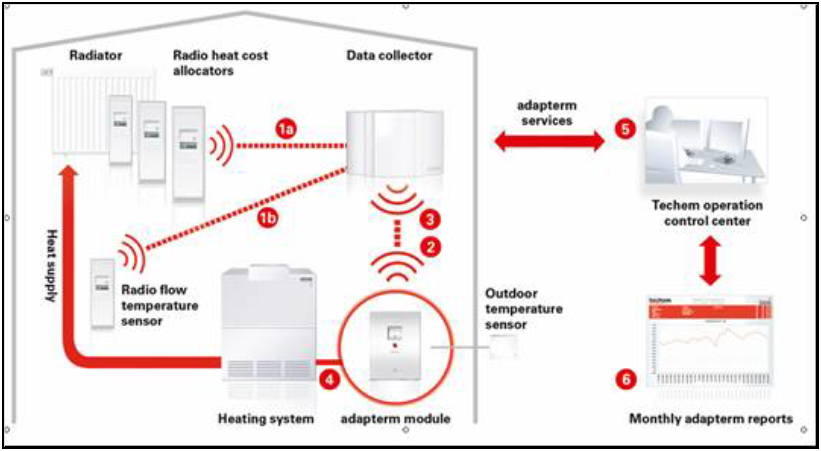
The aim of early default and maintenance management is to utilise (big) data from the surveillance of the systems and to be able to react and solve the problems more rapidly than before. For example, see the screenshot on the right which is from the Darmstadt BECA site; it shows how the adapterm system works: If abnormal values are identified, they can easily be traced back to their point of origin allowing for quick countermeasures to be taken and / or the overall setting of the heating system to be optimised.
In Catalonia, the central solar system is equipped with a system of early default detection and maintenance management. If the production of the central solar system remains very low or is equal to 0 during three consecutive days, an email is automatically sent to the maintenance company as well as to the service provider. Thus, a revision of the system is possible and the problem can be solved within 3 days.
Renewables

Smart metering can be used to integrate the growing number of embedded renewable generators, such as wind and photovoltaic. Smart Metering systems can readily be set up to measure exported power, when the housing unit use less power than it generates. Such systems can also measure the output of the generator and supply this data to the energy company to provide a complete picture of the generator’s performance.
Modern district heating plant appropriate for use in social housing is available fired with renewable energy sources and built as combined heat and power CHP to provide additional, cost-effective power generation. Manufacturers of these and other decentralised energy supply installations like solar panels already provide ICT components for systems monitoring and control – products are equipped with up-to-date measurement and control devices and local screens which show current operation parameters.
Storage

The extension of renewable management and peak shaving / demand response would be to actively manage the own production as well as utilise price differences in the grid. Localised electricity storage can save some of the energy supplied in abundance during sunny noons or windy evenings to reduce costs and to avoid peaks for the grid by supplying energy locally from storage.
Energy can also be stored as heat and cold by, for instance, heating up the building or a water tank with cheap energy to avoid this effort when energy supply is more critical. There will be a few losses but the opportunity cost might be lower locally (lower prices) but also on grid level (avoiding back-up plants and turning off power plants).
This feature has not yet been applied by the pilot sites as this was not the area of the projects. However, several sites are doing research in the domain of local storage and advanced demand response. Should the opportunity arise, will this Guide be extended by the documentation for such projects and services.