Outcomes
This period covers the monitoring and ensuring success by implementing procedures and keeping information flowing. This also includes finding the next opportunity and hidden benefits.
Operation
At any time during service operation, problems can occur, be it with users, data delivery and quality or system maintenance. To prevent tenants from losing interest in the services implemented, the implementation team should maintain close contact to tenants and professional users. A pro-active approach to addressing emerging problems is highly recommended.
If not done already, a “Help Desk” should be set up and the checklists filled as part of Preparing Operation should be revised.
Evaluation
Impacts on Energy Efficiency and GHG emissions
Tracking results of initiatives for implementation of smart metering is a powerful tool to underscore their efficacy and promote public awareness. Tracked results can also be used as a rationale for obtaining additional funding or for gaining public support for a broader portfolio of programs.
The methodology for conducting measurement of the system’s impact on energy efficiency consists of the following components:
- Definition of ratios, terms and options;
- Presentation of relevant general methodologies;
- Calculations of energy savings based on pre-post comparisons including the definition of baseline and reporting period, the methods for (temperature) adjustments and the consideration of different situations;
- Definition of a control-group design as additional or alternative source of estimation;
- Alternative options of savings calculations if neither pre-post comparisons nor control groups are appropriate;
- Determination of further relevant parameters (persistence, statistical data analysis);
- Methodology for demand response estimation (peak demand reduction);
- Methodology for the estimation of avoided CO2 emissions.
It is recommended to make use of internationally accepted standards for evaluation of an intervention’s impacts on energy consumption. The International Performance Measurement and Verification Protocol (IPMVP) appears to be most suitable for the purpose at hand.
Note
empirica has designed and hosts an online tool which applies IPMVP methodology such as correcting for heating degree days. The tool is called eeMeasure and all results of the projects referenced in Guide can be found its website.
International Performance Measurement and Verification Protocol
IPMVP specifies that energy consumption of buildings should be measured with calibrated metering systems. Each energy type needs its own metering system, which should be independent from each other (see measurement boundaries, IPMVP, vol. 1, p14). The IPMVP measurement and verification plan (M&V Plan) provides a framework containing basic methods that are important for evaluation planning. A complete M&V Plan includes the following 13 topics (IPMVP, vol. 1, p39 ff.):
- Intent of energy conservation measures (ECM): Description of the planned services, conditions and intended results
- Selection of option and measurement boundary: IPMVP differentiates between four options to specify determinations of savings (IPMVP, vol. 1, p21f and fig. 3 on page 37)
- Definition of baseline: Period, energy data and conditions (independent variables such as outdoor temperature; static factors such as building characteristics or equipment inventory)
- Definition of reporting period: Period after intervention, e.g. installation of edss or ems
- Definition of basis for adjustment: Description of a set of conditions to which all energy measurements will be adjusted (e.g. temperature adjustments)
- Specification of analysis procedure: Used statistical data analysis procedures
- Specification of energy prices: Prices that will be used to value the savings (of importance in cases of adjustment needs because of prices changes)
- Meter specifications: Description of metering points and periods (of importance in cases of not continuous energy consumption metering)
- Assignment of monitoring responsibilities: Definition of responsibilities for recording and reporting of energy data
- Evaluation of expected accuracy: Statistical accuracy of the measurement
- Definition of budget required for savings determination: Initial set-up costs and ongoing costs throughout the reporting period
- Specification of report format: Description of how result will be reported and documented
- Specification of quality assurance: Description of quality assurance procedures
The M&V Plan mainly focuses on meter installation, calibration and maintenance; data gathering and screening; development of computation methods and – if necessary – acceptable estimations; computation of measured data and reporting, quality assurance and third-party-verification of reports.
IPMVP provides four options for determining savings
For most ICT-enabled implementation projects, option C is most suitable. It basically means a before-after comparison (i.e. before and after an intervention, e.g. the implementation of smart metering based consumption feedback solution) using prior consumption for an estimation of “non-intervention consumption”. An additional or alternative source of estimation is a control building approach – in particular if no baseline energy consumption data are available as the system has been installed in a newly erected building.
Option (A) Retrofit Isolation – Key Parameter Measurement: Savings are determined by field measurement of the key performance parameter(s) which define the energy use of the energy conservation measure’s (ECM) affected system(s) and/or the success of the project. Parameters not selected for field measurement are estimated. Estimates can be based on historical data, manufacturer’s specifications, or engineering judgment. Documentation of the source or justification of the estimated parameter is required. Typical applications include a lighting retrofit, where the power drawn can be monitored and hours of operation can be estimated.
Option (B) Retrofit Isolation – All Parameter Measurement: Savings are determined by field measurement of all key performance parameters which define the energy use of the ECM-affected system. Typical applications include a lighting retrofit where both power drawn and hours of operation are recorded.
Option (C) Whole Facility: Savings are determined by measuring energy use at the whole facility or sub-facility level. This approach is likely to require a regression analysis or similar to account for independent variables such as outdoor air temperature, for example. Typical examples include measurement of a facility where several ECMs have been implemented, or where the ECM is expected to affect all equipment in a facility.
Option (D) Calibrated Simulation: Savings are determined through simulation of the energy use of the whole facility, or of a sub-facility. Simulation routines are demonstrated to adequately model actual energy performance measured in the facility. This Option usually requires considerable skill in calibrated simulation. Typical applications include measurement of a facility where several ECMs have been implemented, but no historical energy data is available.
*Source: See IPMVP public library of documents
Evaluation Designs
In order to calculate changes in energy consumption in consequence of an intervention a comparison of measured energy consumption data before (baseline period) and after the intervention start (reporting period) is useful. Of importance is to ensure that comparable baseline consumption data are available. In the best of cases both baseline and reporting period cover full operating cycles (e.g. one heating period or one year.
Before-After analysis
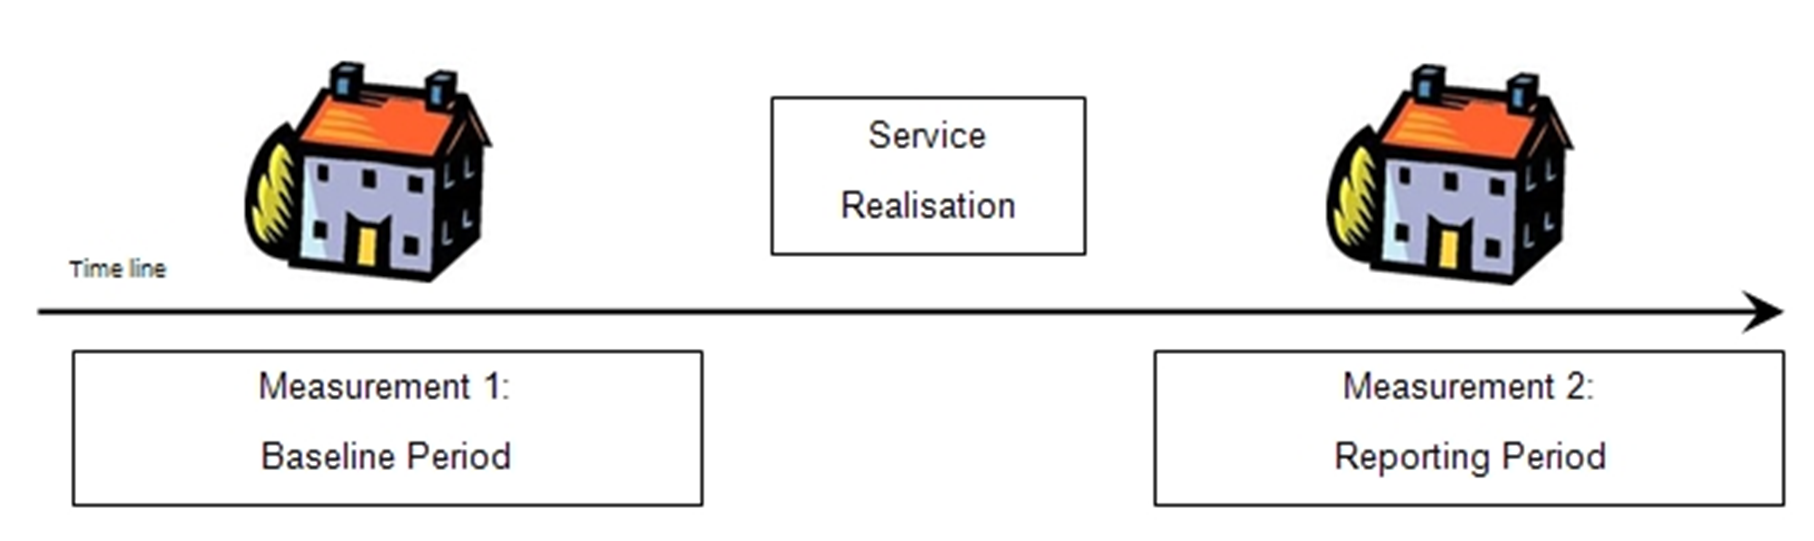
To ensure the conclusion that energy savings are caused by the system installed, all other conditions influencing energy consumption have to be identical in both baseline and reporting period (ceteris paribus). Furthermore the measurement of data itself has to be the same or has to be on a comparable basis in both periods.
In practice, this means that comparisons of e.g. heating energy consumption between two or more heating periods (e.g. pre-post-comparisons) require an adjustment which accounts for the fact that climate conditions are bound to differ between both periods. This is called temperature adjustment. Different methods for this are in use.
The methodology most widely used in Europe is the Heating Degree Day (HDD) Calculation Model. Heating degree days are typical indicators of household energy consumption for space heating. The air temperature in a building is on average 2°C to 3°C higher than that of the air outside. A temperature of 18°C indoors corresponds to an outside temperature of about 15.5° C. If the air temperature outside is 1°C below 15.5°C, then heating is required to maintain a temperature of about 18°C. If the outside temperature is 1°C below the average temperature it is accounted as 1 degree-day. The sum of the degree days over periods such as a month or an entire heating season is used in calculating the amount of heating required for a building.
Degree Days are also used to estimate air conditioning usage during the warm season. Instructions how to apply the model are available from IPMVP or from eeMeasure.
Control Group
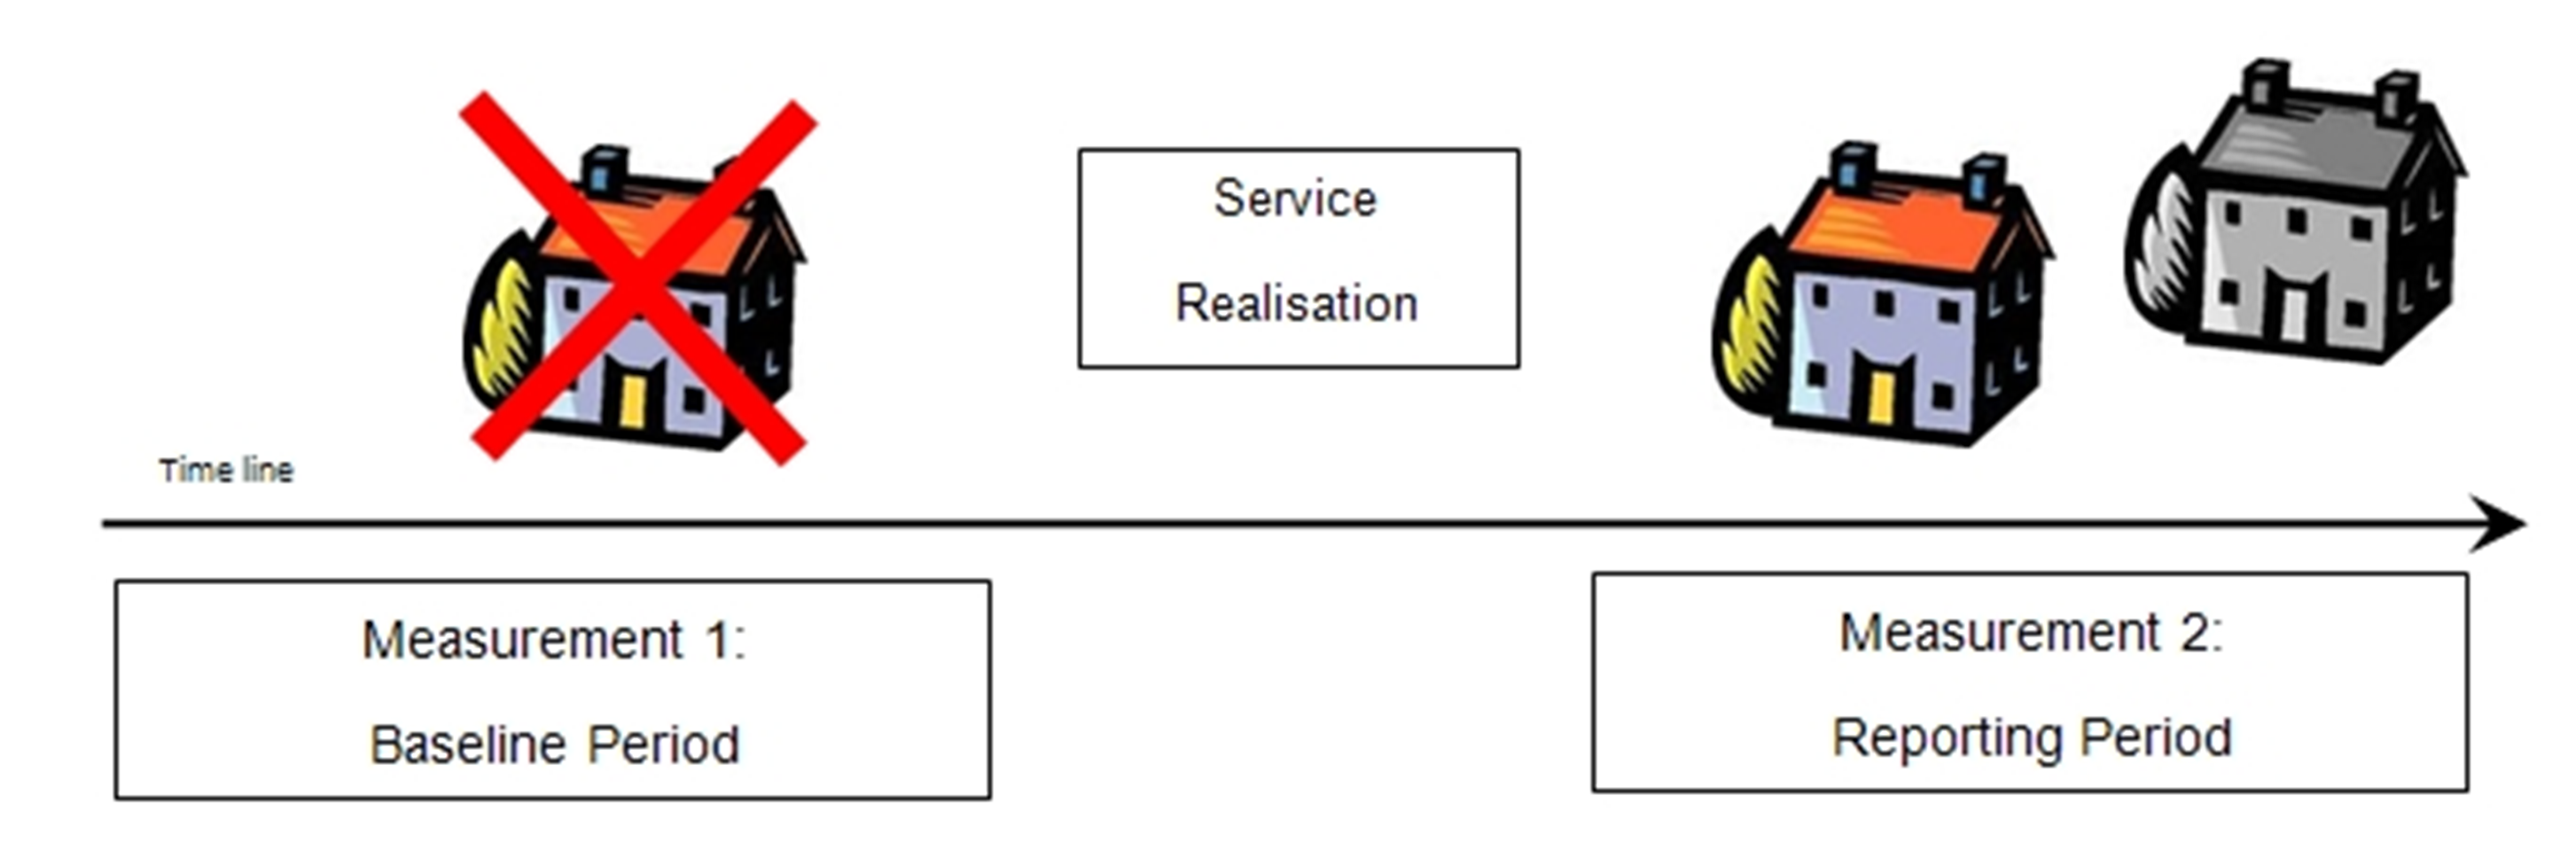
If no adequate baseline energy consumption data are available – for example in case of new constructions or due to different measurement methods/technologies – a control building methodology allows obtaining comparable energy consumption data.
A control building is a similar building which roughly matches the characteristics of the building to be evaluated (e.g. kind of building, location, equipment, insulation, heating system, relation of public and private areas). The control building should also more or less match the building to be evaluated in terms of socio-demographic characteristics of tenants.
In the best of cases the only difference between both experimental and control building is the availability / absence of an intervention (ceteris paribus conditions). The advantage of a control building design is – as its name implies – that the impact of an intervention can be controlled for other influencing effects, and that no temperature adjustment is required if data is collected for the same reporting period.
Cost-Benefit-Analysis
The goal of Cost-Benefit Analysis (CBA) is to find the point in time when the investment pays off but also potentials for further savings. It divides the analysis in a qualitative and a quantitative part. The approach presented here follows recommendations by the European Commission.
Hint
empirica has numerous tools, including a comprehensive CBA, covering all resources, supporting numerous stakeholders, CAPEX, OPEX and other indicators.
EU Recommendations
The European Commission published recommendations regarding the ‘Recommendation on preparations for the roll-out of smart metering systems’ [2012/148/EU] [1] containing details focusing on the cost-benefit analysis of smart metering deployment. The document is widely based on two Joined Research Centre (JCR) studies providing guidelines on conducting cost-benefit analysis of smart grid projects [2] and smart metering deployment. [3]
Hint
The content and the application of EC recommendations is described in more detail in deliverable D8.3.
In accordance with Directive 2009/72/EC, Member States were expected to complete, by 3rd September 2012, a cost- benefit assessment of the roll-out of smart metering systems. In order to facilitate the assessment , the EC issued recommendations - described in the following section - in order to improve the depth and comparability of analyses. As suggested by the Smart Grid Task Force , the criteria contain quantifiable indicators.
Although the recommendations are focusing upon a nation-wide deployment, or in the case of electricity on smart grids (including production and transmission), the SMARTSPACES CBA almost fully follows these recommendations. In fact, in many aspects the tool goes beyond the proposed indicators. Results gathered by the SMARTSPACES analysis can be useful for any nation-wide and European assessment of smart metering and full-scale smart grid deployments.
Tailoring to local conditions
Any authority designated for this task should examine and consider appropriate pilot programmes and other ‘real-life’ experience that exists to fine-tune assumptions and results. At least two forecast scenarios should be considered, one of them being ‘business as usual’ (‘do nothing and nothing happens’). Any scenarios should take into account synergies between existing and future energy-saving measures along with other forms of feedback and advice to consumers, especially the introduction of frequent billing or cost statements based on actual consumption rather than flat rates or estimated consumption.
Cost-benefit analysis (CBA)
The CBA should follow the supporting guidelines (7 steps) which are presented further below. Further requirements are to document calculations; explicitly state any costs which might have to be incurred by customers and compare these with long-term benefits. The Commission also provides a non-exhaustive list of indicators.
Sensitivity analysis
A sensitivity analysis has to identify the critical variables first and report the magnitude of the variable ranges. Additionally, volatility responses and control measures to keep values of variables within desired range could be considered in the analysis. (This is more relevant for very large investments or macro-economic dimensions. Otherwise, the indicator’s share of total cost is usually a good orientation.)
Performance assessment, externalities and social impact
The assessment should ensure that using appropriate weighting factors externalities such as environment and health are taken into account as part of the CBA. The analysis complements the quantitative results with insights, for instance, on measures that could be combined with the roll-out.
Indicators proposed by the EC
Various indicators are being proposed by the EC document based on the research performed by the JRC. Since the methodology is designed as a CBA for nation-wide roll-outs of smart metering, certain indicators are not relevant for SMARTSPACES project (or the partners were not granted access by external parties to data required). For instance, electricity transmission is not relevant. It has to be pointed out that most indicators listed in the recommendations focus on electricity only.
—— Footnotes
| [1] | 2012/148/EU: Commission recommendation on preparations for the roll-out of smart metering systems. Official Journal L 73, 13/03/2012, p. 9. |
| [2] | European Commission — Joint Research Centre Institute for Energy and Transport (2012). ‘Guidelines for conducting a cost-benefit analysis of smart grid projects’, available at: http://ses.jrc.ec.europa.eu/ |
| [3] | European Commission — Joint Research Centre Institute for Energy and Transport (2012). ‘Guidelines for cost- benefit analysis of smart metering deployment’, available at: http://ses.jrc.ec.europa.eu/ |
Qualitative Analysis
In the area of exploitation or business planning and development there exists a plethora of technical terms and concepts, the meaning of which can – depending on author and circumstances – vary to a great extent. This section aims at providing a concentrated overview of some selected terms, widely used within business framework
Strategy
“Strategy is the direction and scope of an organisation over the long-term: which achieves advantage for the organisation through its configuration of resources within a challenging environment, to meet the needs of markets and to fulfil stakeholder expectations”. [4] It deals with challenges of:
- Where the business is trying to get to in the long-term – its direction
- Which markets it should be in – its market
- Which activities are involved in the markets – its scope
- How the business should perform better than the competition in those markets – its advantage
- Which resources of skills, assets, finance, relationships, technical competence and facilities are needed to compete – its resources
- What external, environmental factors affect the businesses’ ability to compete – its environment
- Which values and expectations are held by those who have power in and around the business – its stakeholders
SWOT
In the framework of strategic planning, SWOT (Strengths, Weaknesses, Opportunities and Threats) analysis plays a particular role in assessing a company’s internal position and evaluating external environmental influences. “The investigation of the internal environment will accordingly result in an overview of all weaknesses and strengths of the company, while the investigation of the external environment will result in an overview of all opportunities and threats. These are the results of the SWOT-analysis.” [5]
In this context, internal environment comprises of factors and variables within company itself (e.g. company’s structure, culture and resource; customers; shareholders; etc.), while external environment entails aspects outside the company (e.g. technology; politics; society; economy; etc.), which the company itself may not have under control in the short run.
- Strengths – definition of areas the company or organization excels in:
- key priorities
- key competences
- competitive advantages in the market.
- resources, assets and people
- unique selling proposition
- Weaknesses – evaluation of company’s liabilities and own known vulnerabilities:
- what the company can improve
- what it should avoid
- gaps in capabilities
- financial reliability
- factors influencing weakening of competitive strength or market reputation
- Opportunities – spot useful opportunities in market developments and interesting trends
- possibilities to enter new markets
- advanced developments in technology and innovation
- changes in government policies
- potential partnerships, joint ventures or strategic alliances
- competitors’ vulnerabilities
- Threats – assessment of potential challenges and monitoring of competitors
- encountered obstacles
- influence of political, legislative or environmental changes
- ability to adapt with changing technology
- cash-flow or debts problems
- influence of economic volatilities home and abroad
—— Footnotes
| [4] | Johnson, G., Scholes, K. and Whittington, R. (2008): Exploring Corporate Strategy: Texts and Cases, 8th edition, ISBN: 978-0273711925, p. 3. |
| [5] | Houben, G., Lenie, K. And Vanhoof K. (1999): “A knowledge-based SWOT-analysis system as an instrument for strategic planning in small and medium sized enterprises”. Decision Support Systems 26:125–135, p. 126. |
Quantitative Analysis
The main purpose of the business case modelling exercise is to inform service development as far as requirements from the business side are concerned and to ensure that these requirements are met to the greatest possible extent. This includes the analysis of service costs and benefits of different actors, the due consideration of financing means and the re-modelling of the service concept to ensure economic viability.
In methodological regard the approach is built around a cost-benefit analysis (CBA) that was chosen over alternative approaches (such as cost-effectiveness analysis and cost-utility analysis) because it allows for adopting a multi-stakeholder perspective, i.e. costs and benefits can be analysed separately for different actors. This is of particular advantage in the fragmented environment for energy efficiency measures, where many different actors (tenants, social housing companies, measurement and service providers, the IT industry and others) are involved, whose costs and benefits need to be balanced individually to achieve a viable and sustainable service model.
In brief: socio-economic return
Socio-economic return describes the relative benefits to the necessary costs of any given investment. The majority of indicators covered in the cost-benefit analysis can be directly expressed in financial terms (capital costs and labour) but the tool also covers intangibles which are socio-economic benefits expressed in monetary terms (e.g. convenience). All values are net present discounted over time.
The graphs for the total socio-economic return presented for each pilot site are based on the costs and benefits occurring within the pilot site (not including EC-funding). If the sum of all costs within a year is higher than the sum of all benefits the graph’s path will be below the zero line. The investment breaks even as soon as the cumulated benefits of all years, up to the point in time, become equal with the costs. Once the graph reaches 100%, the benefits are twice as high as the costs (e.g. 100EUR costs and 200EUR benefits) and so on. The underlying formulae and detailed descriptions can be found in deliverable D8.3.
In principle, a CBA values all the effects of both the reference scenario and of the intervention. The intervention should only be implemented if the present value of the benefits exceeds the present value of the costs, so that the intervention yields a socio-economic profit.
Concept and (most) basic Calculation

The key indicator for the assessment is the (socio-) economic return putting additional benefit and cost in context. Additional costs and benefits are the amounts which result from the change caused by intervention: For instance, the old meter costs 100€ while the new meter costs 110€. In this case only the 10€ difference is “relevant” for the cost-benefit analysis since the first 100€ would have been spent regardless – the same principle applies to benefits. The sum of all additional benefits needs to be compared with the sum of all additional costs. This calculation is summarised with the simple formula.
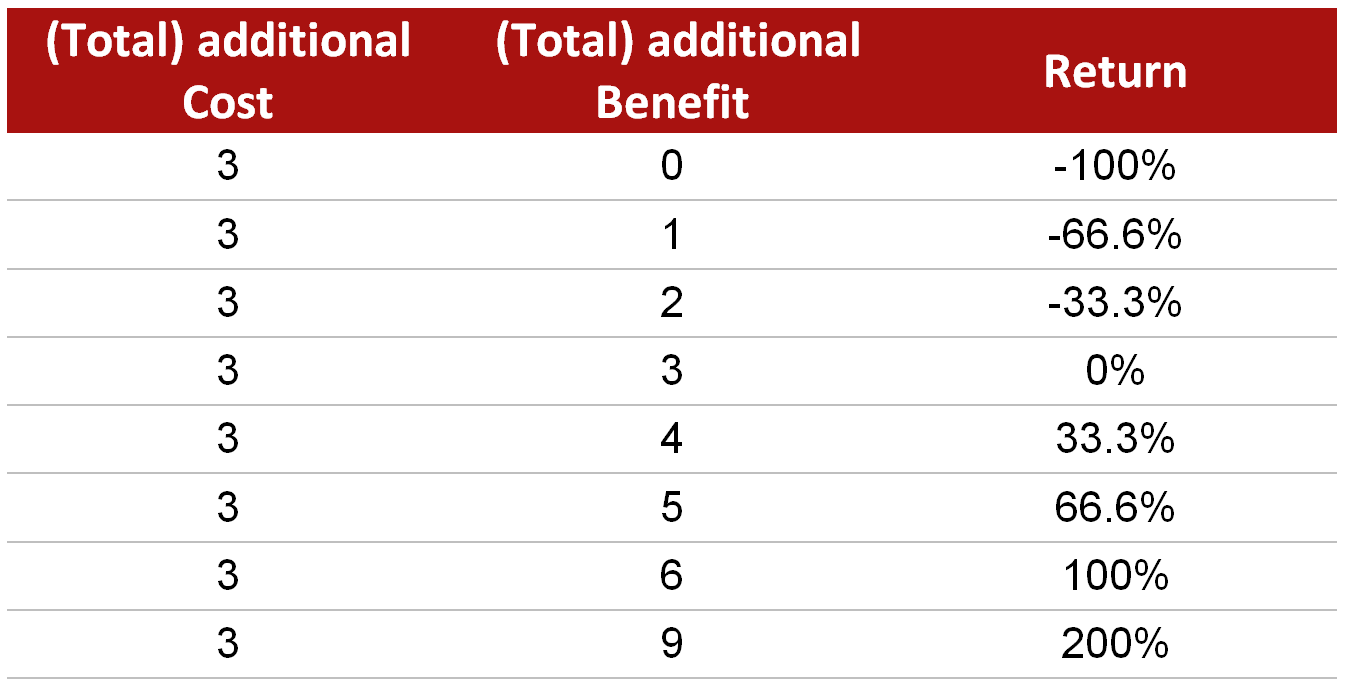
The result of this formula is a percentage which indicates whether the return is negative (-100% to 0%), the intervention does not change the cost return (0%) or whether the return is positive (>0%). A 100% return implies that the investment paid back completely and that the additionally generated benefit equals the additional cost, hence, the benefit is twice as high as the cost. The table provides examples for possible results.
Example Paths
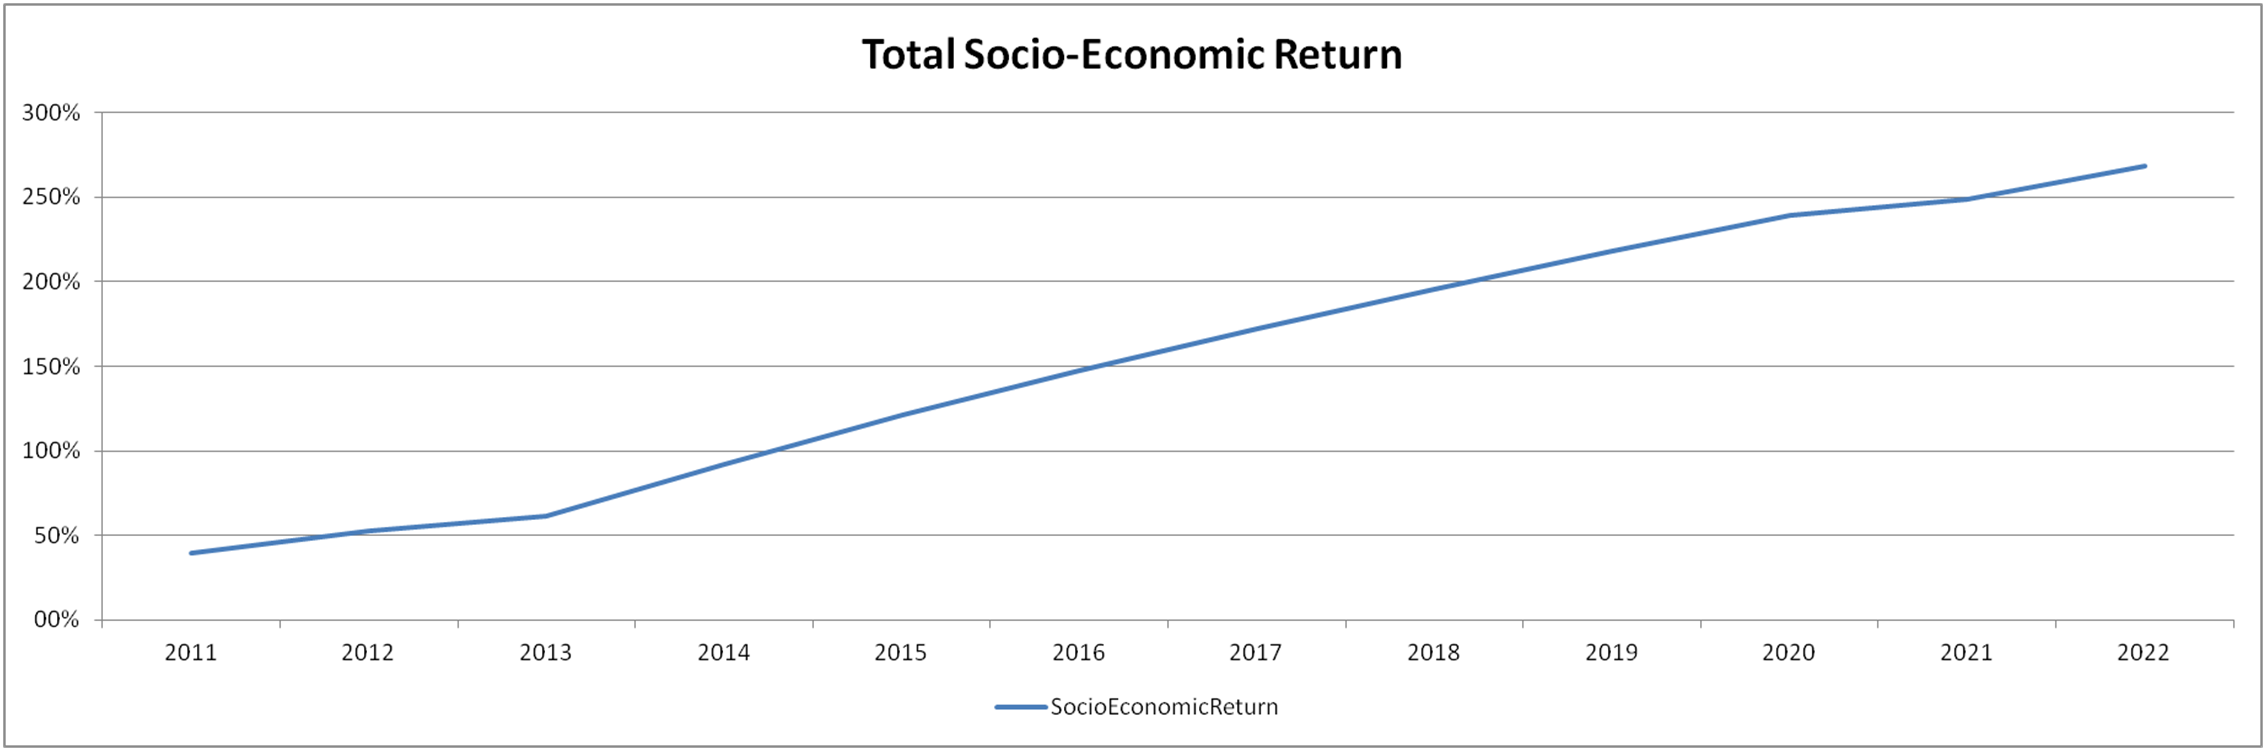
Linear profit with high implementation costs
In the graphical representation below, the path starts below zero which implies that the implementation (and operation) costs - in the first year - are higher than overall profits combined until the paths crosses the zero-line (break even) in year 3. Since the path is constantly increasing it can be concluded that benefits are higher than the operational costs occurring each year.
Regular replacement of equipment
As illustrated, the path in the graph below shows regular dips on the total return in years 2015 and 2019. These most likely coincide with the year of certain equipment (e.g. metering) which needs to be replaced / maintained due to the end of the lifetime. Other observations are similar to the first scenario described above.
Replication Scenarios
Metering availability
Two options are available depending on whether the reader already has smart meters.
No (smart) metering: Upgrading the building portfolio
The majority of buildings in a municipality do already exist. Only a fraction (<2%) is being renovated every year. Even if the rate would increase it would take decades before the consumption of the existing building portfolio would be reduced. ICT-enabled services are an option to reduce the consumption by several per cent often paying off without additional costs. Any savings will reduce the environmental impact of the municipality and make the public body ‘lead by example’. The common misconception is that ICT-services wish to replace potentially higher savings achieved with measures requiring construction efforts: This is not the case. Both efforts have their justification and contribute to savings in different ways.
A key requirement is a sufficient amount of metering infrastructure of which the data recorded can be linked to a heating / cooling system or the consumption behaviour from a certain group of people. This is usually achieved by dividing the building into zones (Hagen). Depending on the resource a different number of zones might be advisable. Decide whether the metering is to be kept in-house (see business model) or provided by a third party. If another party is involved (e.g. ESCO) try to create an incentive for the company to achieve savings with the infrastructure (e.g. contracting) hereby also ensuring that not more hardware is installed than necessary.
Hint
Business model to consider: Some municipalities are paying large fees for measurement and billing. In some pilots replacing these external devices by council owned meters paid of within a few years avoiding fees. This would also ensure that data access as well as (temporary) increase of frequency is easier to accomplish (Murcia).
In some countries (and resources), smart metering is / will be compulsory (e.g. UK). Make sure the investment does serve another purpose but to meet regulation. If you still have influence on where and how many meters to install, consider questions above and based on the building type.
Smart metering already available
The conclusion is simple. Deploy an ICT-enabled edss service. The data is already available and the municipality is paying for it: You need find the party storing the data. The frequency of the meter readings might be adjustable for your needs without changes to the contract.
There are numerous energy platforms already available on the market and flexible to adopt existing data based minimising the development effort (Bristol) and cost. The centralised platform can be made available to the staff within in the municipality network. The graphics provided will enable professionals to understand their own building better. Try to recruit ‘champions’ who will search for irregularities and act upon it. Once buildings with unusually high consumption are identified, raise awareness with campaigns.
edss can also be used for transparency regarding consumption and to educate the wider public about energy consumption. Provide a kiosk system for visitors and tell them on how they can reduce energy at home (Belgrade). This might be especially useful in countries in which individualised metering is unknown.
A basic form of ems should also be implemented. Allow professionals to set alarms notifying them about irregularities regarding consumption (and production). This will increase the speed with which wastage is detected. Utilise the data gathered also in future planning such as decision on where and how to modernise buildings.
Hint
Business model to consider: The majority of cost is due regardless of whether you provide a service (meters, communication fees). Find a supplier, maybe a local start-up / SME, to implement and host a portal, and make energy consumption data available based on a simple licence fee.
Resource consumption
Depending on the total consumption, ICT-enabled services provide benefits for varying reasons. Total consumption can be driven by various factors (e.g. size, visitors, age, for heat/cold insulation/piping/technology etc.) which can be combined in many different ways. Trying to cover all combinations would reduce the number of cases in a city. Since the total number of public buildings in one municipality is already small, coherency is much more important than (pretended) plausibility.
Heat / Cold / Ventilation
Heat and cold and air are being produced on site (or pumped through a grid). This also means that the boilers and associated equipment are within the permit of the building. The market for these products has increased dramatically over the years as more and more heating concepts exist. More buildings are now heated by a heat pump (consuming electricity) and a small gas boiler only exists to cover when it turns very cold. However, empirica observed in residential and public buildings that the error of gas boilers frequently firing seems to persist. With regard to programming it is rational to assume a worst case scenario if measurement values are not reliable and boilers often only rely on their own sensors.
ICT-enabled services can ensure that data is always available and any firing of the planned traced back so, should another fault exist, this can be identified. As for larger and often smarter boilers, the adaptation of heating curves (Hagen, Venlo), can bear huge saving potentials as any wrong setting will automatically have a huge effect on consumption in large buildings.
Electricity
Modern appliances are often connected to IP-networks or can receive signals through the plug. For instance, IP-telephones in office buildings can work as a measure of occupancy. The worker needs to turn off the phone and as a result all devices linked to the phones are also shut-down (Milan).
With advances in LED street-light and lighting concepts, a wide range of solutions is possible. The challenge is now more in integrating other services into the lamps which can work as network access points and wireless repeaters in sensitive environments such as hospitals (Moulins).
Water
In any regular public building, water consumption should be somewhat a constant. Consumption is limited to restrooms and maybe smaller kitchens. Hence, metering does not need to be divided into many zones unless different parts of the building are sometimes shut-down (e.g. weekend) whilst others remain operational. For instance, a sports hall might be used all week for competitions whilst the school is closed. In such a case, no consumption should occur in the school whilst showers and restrooms are being used in the sports hall even on a weekend.
Regardless, metering on wider level helps to identify whether any wastage occurred by using simple alarms (ems) and / or regular checks of consumption (edss). Moreover, comparison between buildings allows identifying whether there are considerable differences of average per head consumption. This might be interesting in schools to check which one has the best approach to educate their pupils etc.
Public display of consumption – at least in a portal – will also act as social control and maybe remind the individual to close the tap whilst washing their hands.
Building
Depending on the building type / quality different cases can be made for a deployment of ICT-enabled services.
Old / wasteful buildings
Older buildings are often heritage sites and therefore protected (Birmingham). These buildings coped with weather and requirements for a long time. Those wasteful buildings which are modern (e.g. concrete structure from the 60-70es) have not been renovated for a number of years so it might be worthwhile applying services to reduce the wastage and smoothen the consumption patterns. ICT is replaceable should the day come in which the building is going to be replaced.
Any of these buildings probably suffer from large heat losses. Since the piping is older the probability of any water leakage also increases. In old buildings any work on walls is met with regulation and usually higher costs as more labour and selective materials must be ordered. As for renovation, the outside facade of a heritage building can, often, not be modified. Savings have to be achieved with other means and the higher the consumption the larger are the benefits of any savings even if it is only a few percent.
As these buildings are probably larger (museums, administrative buildings) it is recommended to divide the buildings into several zones so that a leakage cannot only be detected but also tracked down. The data gathered for several zones might also bring evidence on how to heat/cool the building as consumption can strongly depend on the impact of sunlight and wind.
New / highly managed constructions
Most new buildings have to have smart-metering installed. Hence, it is wise to make the technology part of the overall concept and ensure that the ems can control the services installed.
Hint
Business model to consider: If the design and planning contractor is not capable of providing the ICT, employ a specialised SME such as :abbr:`ESCO (Energy Service Cooperation)`s as these are also open to fixed price and / or contracting models.
New buildings are also likely to have a consumption target defined by the architects and designers. Such targets are not always met. The SMARTSPACES service can be used to verify and to identify possible wrong doing and correct any errors enforcing accountability or promises made. Examples show also that the service makes re-adjustments of heating systems etc more successful (Hagen).
Buildings which need to be managed (e.g. swimming pools) might already have the ability to also manage the energy consumption (Istanbul).
Green buildings
Extremely efficient buildings consume less in total and any percent savings is therefore a smaller absolute amount. However, in relative terms behaviour plays a much more important role than in regular buildings. Leaving the window open will increase the total consumption dramatically as a single hole in the insulation will let a lot of hot air escape.
Another issue arises with the different systems interacting to achieve the efficiency. Often two systems divide the work: one for the base load, the other for the peaks. If the systems are not adjusted properly, the peak system might jump in too often. As it is not designed to be turned on often or run long, it is also more likely to break down sooner and add to the cost (Venlo).
Renewables
In the future it is more likely that the market will create incentives for those operating renewables also to consume the energy locally. This has a stabilising effect on the grid as the renewables are often produced at similar times (e.g. noon). This can be achieved by smart devices controlled by an ems or by signals received or by small local storage. The latter can be charged during peak supply and emptied during peak demand.
High number of visitors
Administrative buildings and sport facilities have a diverse range of visitors. It is advisable to provide the general public not only with transparency regarding the consumption of the building but also offer a ‘Kiosk’ system on which the visitor can play an energy efficiency quiz or learn about how certain building systems at home work. The waiting time would then be translated in to an awareness raising campaign (Belgrade).
Lessons learnt
Reguarly evaluate progress
- Impact
- Service in place does not mean it is being used
- All users initially approached with campaings might be replaced due to changes
- Central evaluation recognises larger opportunities including investements
- Recommendation
- Use a standardised approach
- Communicate results to Professional and other users
- If efficency drops, identify reasons and if necessary make users aware of service
- Use data to compare progress over time or between buildings
Make sure success in saving energy is perceived as teamwork
- Impact
- A service without users’s action has no effect, make sure motivation stays up
- Vice-versa: Improvements may raise the question why these have not been reached earlier and can make the responsible for energy efficiency appear in a bad light
- Finally, if one building is successful and everybody knows it, it is also a way to motivate those in a new building
- Recommendation
- Communicate the success and clearly state that the “users” have achieved it
- Communicate that these savings have been achieved with the service and were not possible without
- Make this statements also in a public in a press release etc
Keep a contact point open
- Impact
- There will always be new users and they should have an easy access point
- Recommendation
- Re-use materials
- Use a video channel to explain functionality which can be moderated by a champion
Convince users to replicate good action at home
- Impact
- Some lessons are universal and the trick can be applied eslewhere
- One user communicating the advice to another person is a duplication of awareness
- Recommendation
- Keep a public website or kiosk for general advice
- Use quizes to test knowledge
- Suggest energy saving games with children
- Do not overload - one hint at a time so action can be structured by anyone
Check if other departments might benefit from your infrastructure, resources
- Impact, for instance
- Newly implemented communication protocols could be used in different context
- Data might be used to create checks other than energy (e.g. security, usage of rooms)
- Recommendation
- Approach those often working in building and ask what they wish they would know about their place - be creative
- Approach any departments visiting for maintenance / service