Leicester
Video – Savings – Service – Cost-Benefit – Exploitation – Partners
Twenty public buildings drawn from the City Council portfolio are included in the project. These include seven leisure centres, seven primary schools, two community centres, a concert hall, a museum, an office building and a library. The City Council buildings have 2,000 staff users and 33,000 monthly visitors of which 23,000 are students. Additionally, at the University, the Campus Centre houses the student union offices, a pub, nightclub several shops and a restaurant. The Kimberlin library is the universities’ main library and the John Whitehead building is a university building with a larger proportion of administrative offices. There are 600 staff users and 18,500 visitors to these buildings each month.
The unique aspect of the Leicester approach was the combination of the publically available, simple (or detailed) presentation of the half hourly gas, electricity and water data, combined with the on line discussion forum. That is, the combination of metered data with people discussing these data and maintaining or improving comfort conditions in their buildings, whilst minimising energy and water consumption.
Video
Savings
For more details visit the eeMeasure tool and the SMARTSPACES deliverable D7.2 also covering qualitative surveys.
Service
edss
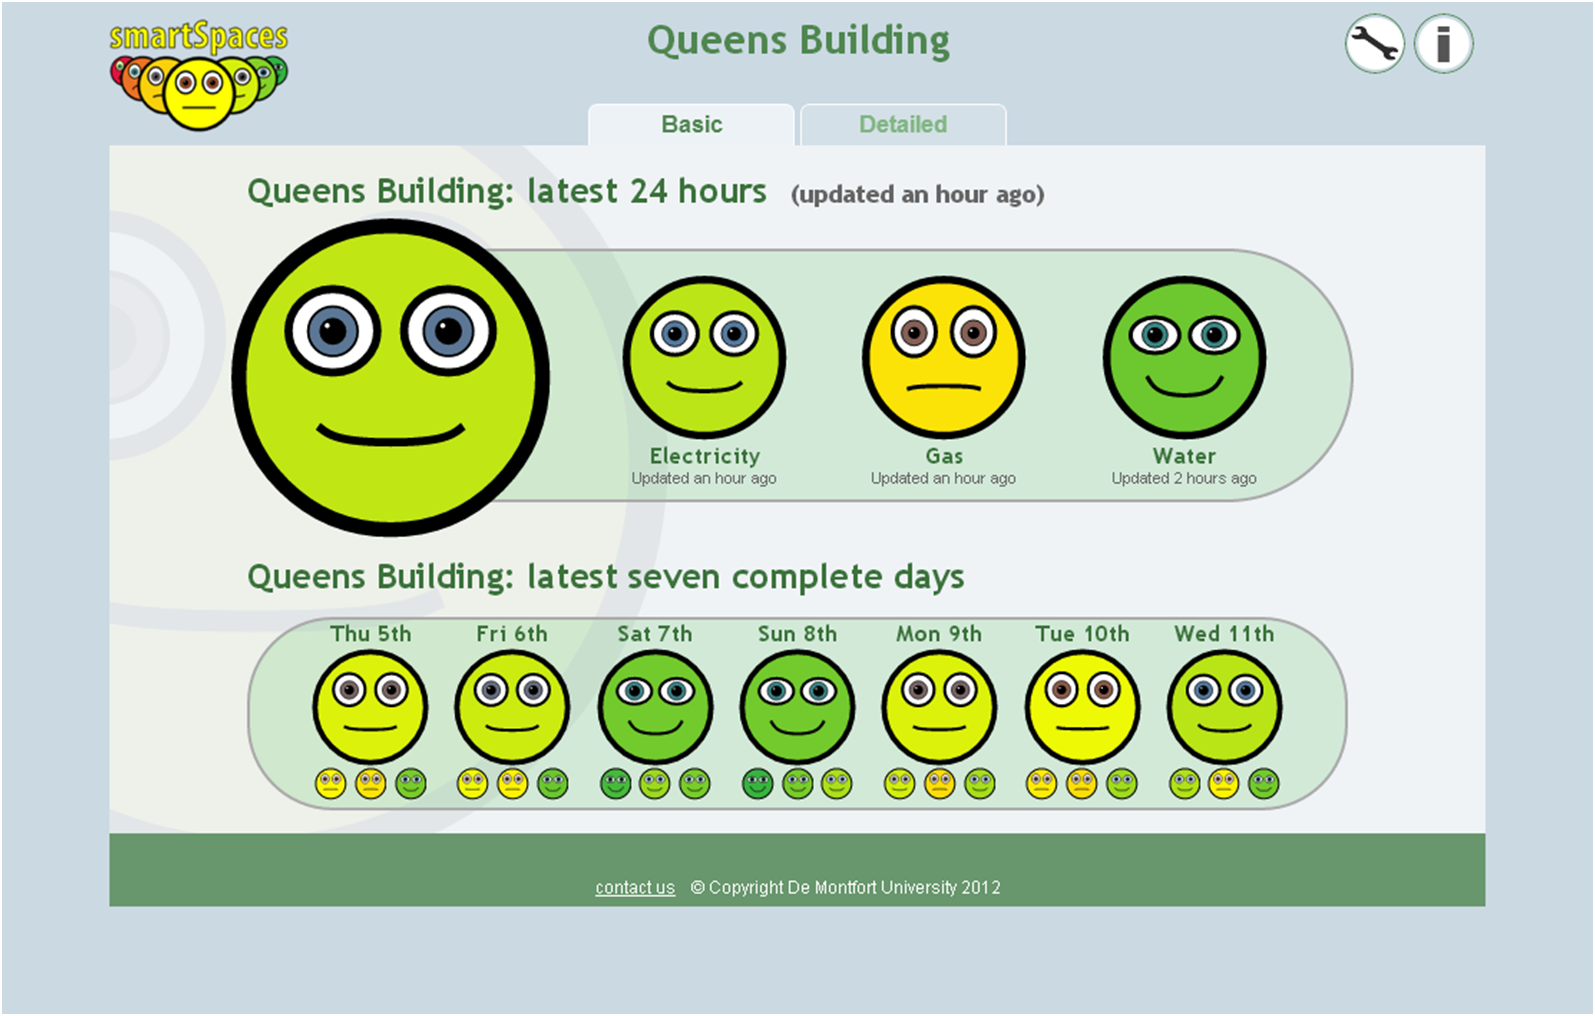
In the Leicester SMARTSPACES services building users were initially presented with a very simple view of energy performance. The first thing they see is the simplest possible view and this included no charts, simply smiley faces. A building user can then understand the overall performance from this smiley face and many users just used this as their main source of information.
Energy data, analysis and visualisations provided were a resource available within the service. But, the service itself needed to be wider than this if it was to be truly engaging. The users should not be simple passive consumers of data/information but must also provide content.
A key idea here was to give building users ‘ownership’ of the issue by them identifying the issue (excessive consumption) and, through the discussion forum, helping to resolve this issue with the energy manager. It was also important to ensure a balance of communication so it is not perceived as ‘them and us’ with ‘the authorities’ imposing a regime of energy vigilance. The approach was to ask questions of building users with the implicit assumption that they are the experts about their own workplace. For example, there were different “threads” in the online forum for different buildings and different issues arising within each building.
ems
There were two main mechanisms where SMARTSPACES services influenced automated control settings. The first was to provide services directly to energy professionals who in turn have access to control settings. The second was to provide building users with the facility to engage in discussions about the performance of their building from within the SMARTSPACES services. This capability was also provided to building energy professionals so that building users had a direct link to the experts and the experts had access to the observations and opinions of building users. That is, there was an on-line dialogue between building users and energy managers and also an on-line dialogue between different building users.
Professionals had access to the Bems and used information provided by the SMARTSPACES ems to alter the Bems settings and configurations. Bems configuration impacted on the following:
- Occupancy schedules and calendar (to apply different settings depending on occupancy)
- Temperature settings
- Night cooling regime
- Lighting control (time until off using PIR sensors)
- Change ventilation rates (including opening and closing windows)
All of these settings were already controlled remotely from a central energy management office, but the feedback from the building users via the on-line discussion forum resulted in further alterations to the control settings.
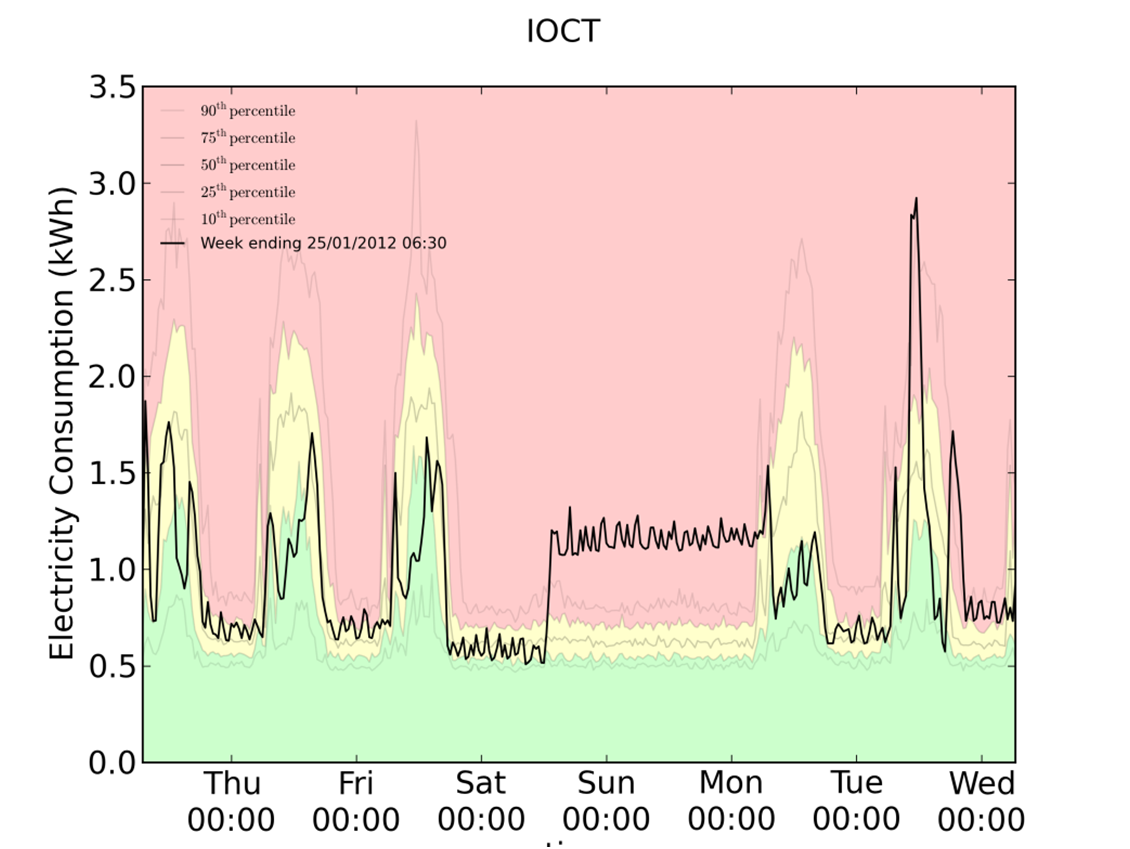
The energy and water consumption information provided on the website showed the expected range of consumption (clearly highlighted in the coloured zones) and contrasted this with the actual consumption (black line). This also included a clickable navigation pane at the bottom of the page which showed a summary of performance over the latest year. This pane allowed the user to easily identify historical periods where performance was good or bad and navigate directly to them by simply clicking and dragging the cursor across the time period of interest.
An energy performance league table was provided and linked with the detailed diagnostic reports. For each period (e.g. each day or week) consumption was compared against that predicted by a baseline consumption model for each building. This was then used to generate a performance indicator showing the current building performance. Buildings were listed in order of performance and this list was directly linked to the more detailed reports.
Value propositions
Smiley Faces displayed on screens in public spaces are an easy way to interpret for anyone without training. Publically available, web based Smiley faces and more detailed time series graphs are able to engage with building users over the energy use in their buildings. This makes a relatively “boring” subject more “exciting”. The graphs explain daily and seasonable shifts and are able to inform the public about changes in building energy use due to temperature, events and faults. As soon as any type of user thinks that they can contribute with information (e.g. observed an open window), they can participate in the on-line forum to share their experiences and enter into a dialogue with other buildings users and with building energy managers. They can act as champions, as peer educators, to discuss their experiences with other buildings users. The system is scalable in number of buildings and resolution.
Up-to-date data is available for download and future analysis by citizens that might produce further insight. Since the solution is being developed on campus, students can be involved in playing with ideas to develop more features creating a community not only for geeks but also researchers. The team already succeeded in publishing the evaluation methodology in a renowned journal [1] and is keen to make further insights from this large and (beyond the project’s life-time) on-going pilot to the research community also contributing further evidence to the ‘Guide for Replication’.
For further expansion of the services, the solution is scalable and able to meet the growing demands of the buildings in Leicester City Council and De Montfort University at an affordable cost. This cost is mainly related to staff time, as the AMR is already installed. Costs would include things such as monitors, cables etc In certain places there would also be some staff resource required to introduce the service and encourage people to get engaged.
Cost-Benefit
The SMARTSPACES project has a positive socio-economic return paying off immediately. The model presented here is assuming a ‘worst-case scenario’ in which no hardware exists. However, all buildings in Leicester are already equipped with metering hardware and only a limited amount of infrastructure and public TV screens would be needed for full deployment (along with training etc.).
Exploitation
Leicester City Council is currently looking at extending SMARTSPACES in three ways. Firstly, the Council plans to expand the services to other appropriate City Council buildings. Buildings where there is considerable interaction with building users, such as administrative buildings, neighbourhood offices and libraries. This is dependent on the available financial resources and the effects of the forthcoming, local, national and mayoral elections. Secondly the Council would like to extend this service to school buildings as part of wider initiatives to reduce carbon emissions in schools, using energy data in the curriculum and engaging with school governors over energy and water use in school buildings. This would be useful to monitor the implementation of renewable energies, monitor the use of Schools outside of School hours and see whether the new BSF schools are really making the savings they have been designed to make. The Council are also keen to offer SMARTSPACES to local businesses as part of a greening business project which will be submitted for ESIF funding in the summer of 2015.
Leicester City Council and DMU have also been active in submitting further proposals for funding. These were to extend the Leicester SMARTSPACES concept of the combination of the publically available meter reading and building user data. This has included UK and EU proposals in big data and the internet of things using social media data and BEMs data to offer additional services. This work is ongoing.
De Montfort University is extending SMARTSPACES to all DMU buildings, from the original 5 buildings to approximately 18 buildings. DMU is in discussions with a Student Accommodation provider to offer a SMARTSPACES service to Halls of residences. DMU are also in discussion with an energy purchasing company to offer a SmartSpaces type service to them. Finally DMU is using the SMARTSPACES approach in its carbon budgeting work.
Leicester City Council and DMU have had discussions with several Local Authorities and Universities who have all expressed an interest in using a SMARTSPACES type service. Leicester City Council actively promoted the service to English Local authorities at Carbon Action Network events which are specifically aimed at local authority officers working ion energy, climate change and fuel poverty. Work is currently underway to define the detail of potential services and to then be able offer some services commercially. Finally, the Leicester exploitation work also looked specially at extending the work from Public Buildings to private buildings - in particular to SMEs. This work has resulted in discussions with the Leicester and Leicestershire Enterprise partnership to use a SMARTSPACES type service in the EU SIF (European Structural invest Fund) projects looking at local carbon support from businesses.
Partners
Within the Leicester City Council the Leicester Energy Agency (LEA) is responsible for energy issues. It is the UK Secretariat for the Carbon Action Network for UK Local Authorities. LEA has been providing advice to all sectors of the community including businesses and community groups to promote renewable energy systems and energy efficiency and specific actions to reduce their environment impact. Leicester is Britain’s first Environment City and the Leicester Energy Agency is a key player in helping the City meet its ambitious target of a 50% Energy Reduction of the 1990 Levels by 2025 and to obtain 20% of the City energy needs from renewable energy. Leicester City Council (LCC) is pilot manager in Leicester and co-operates locally with De Montfort University (DMU).
The Institute of Energy and Sustainable Development (IESD) at De Montfort University <http://www.dmu.ac.uk/home.aspx>`_ is a highly multi-disciplinary research and post graduate institute with expertise in building physics, building energy modeling, ICT, electrical and electronic engineering, social science, energy policy and public engagement. The Institute offers Masters Courses, PhD programmes of study and undertakes research for industry, UK national government and the European Union. The focus of the research is to understand how we can move to a low carbon society. How we can achieve deep cuts in greenhouse gas emissions without adversely affecting quality of life and affecting economic activity. The Institute undertakes research and teaching in the analysis of electricity, gas and water data in buildings and industry. De Montfort University is also coordination partner and has the lead for the evaluation work in the project.
—— Footnotes
| [1] | Wilson, C., Evaluating communication to optimise consumer-directed energy efficiency interventions. Energy Policy (2014), http://dx.doi.org/10.1016/j.enpol.2014.08.025 |


